before and after treatment statistics,effective mental health treatment
1321 Garnet Ave, San Diego CA 92109
Follow us on
Search
1321 Garnet Ave, San Diego CA 92109

Outcomes

0-Day

OUTCOME TRACKING

0%

DEPRESSION SYMPTOM REDUCTION

0%

REDUCTION IN ANXIETY SYMPTOMS

0x More

Individual Sessions Weekly

Proven Results. Results Recovery

At Solara Mental Health, outcomes aren’t a guess—they’re measured. We believe treatment success is the single most important standard of care. That’s why our entire model revolves around tracking results—not just delivering services. Everything else is secondary.


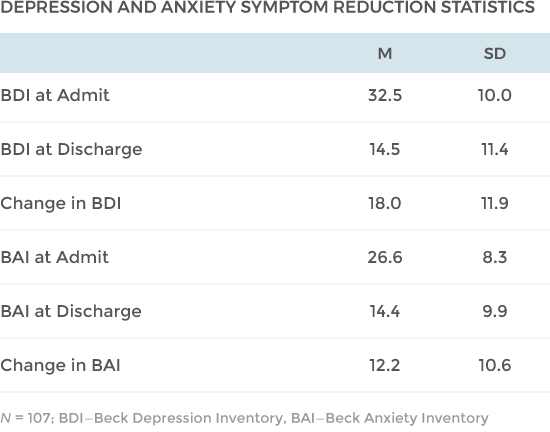
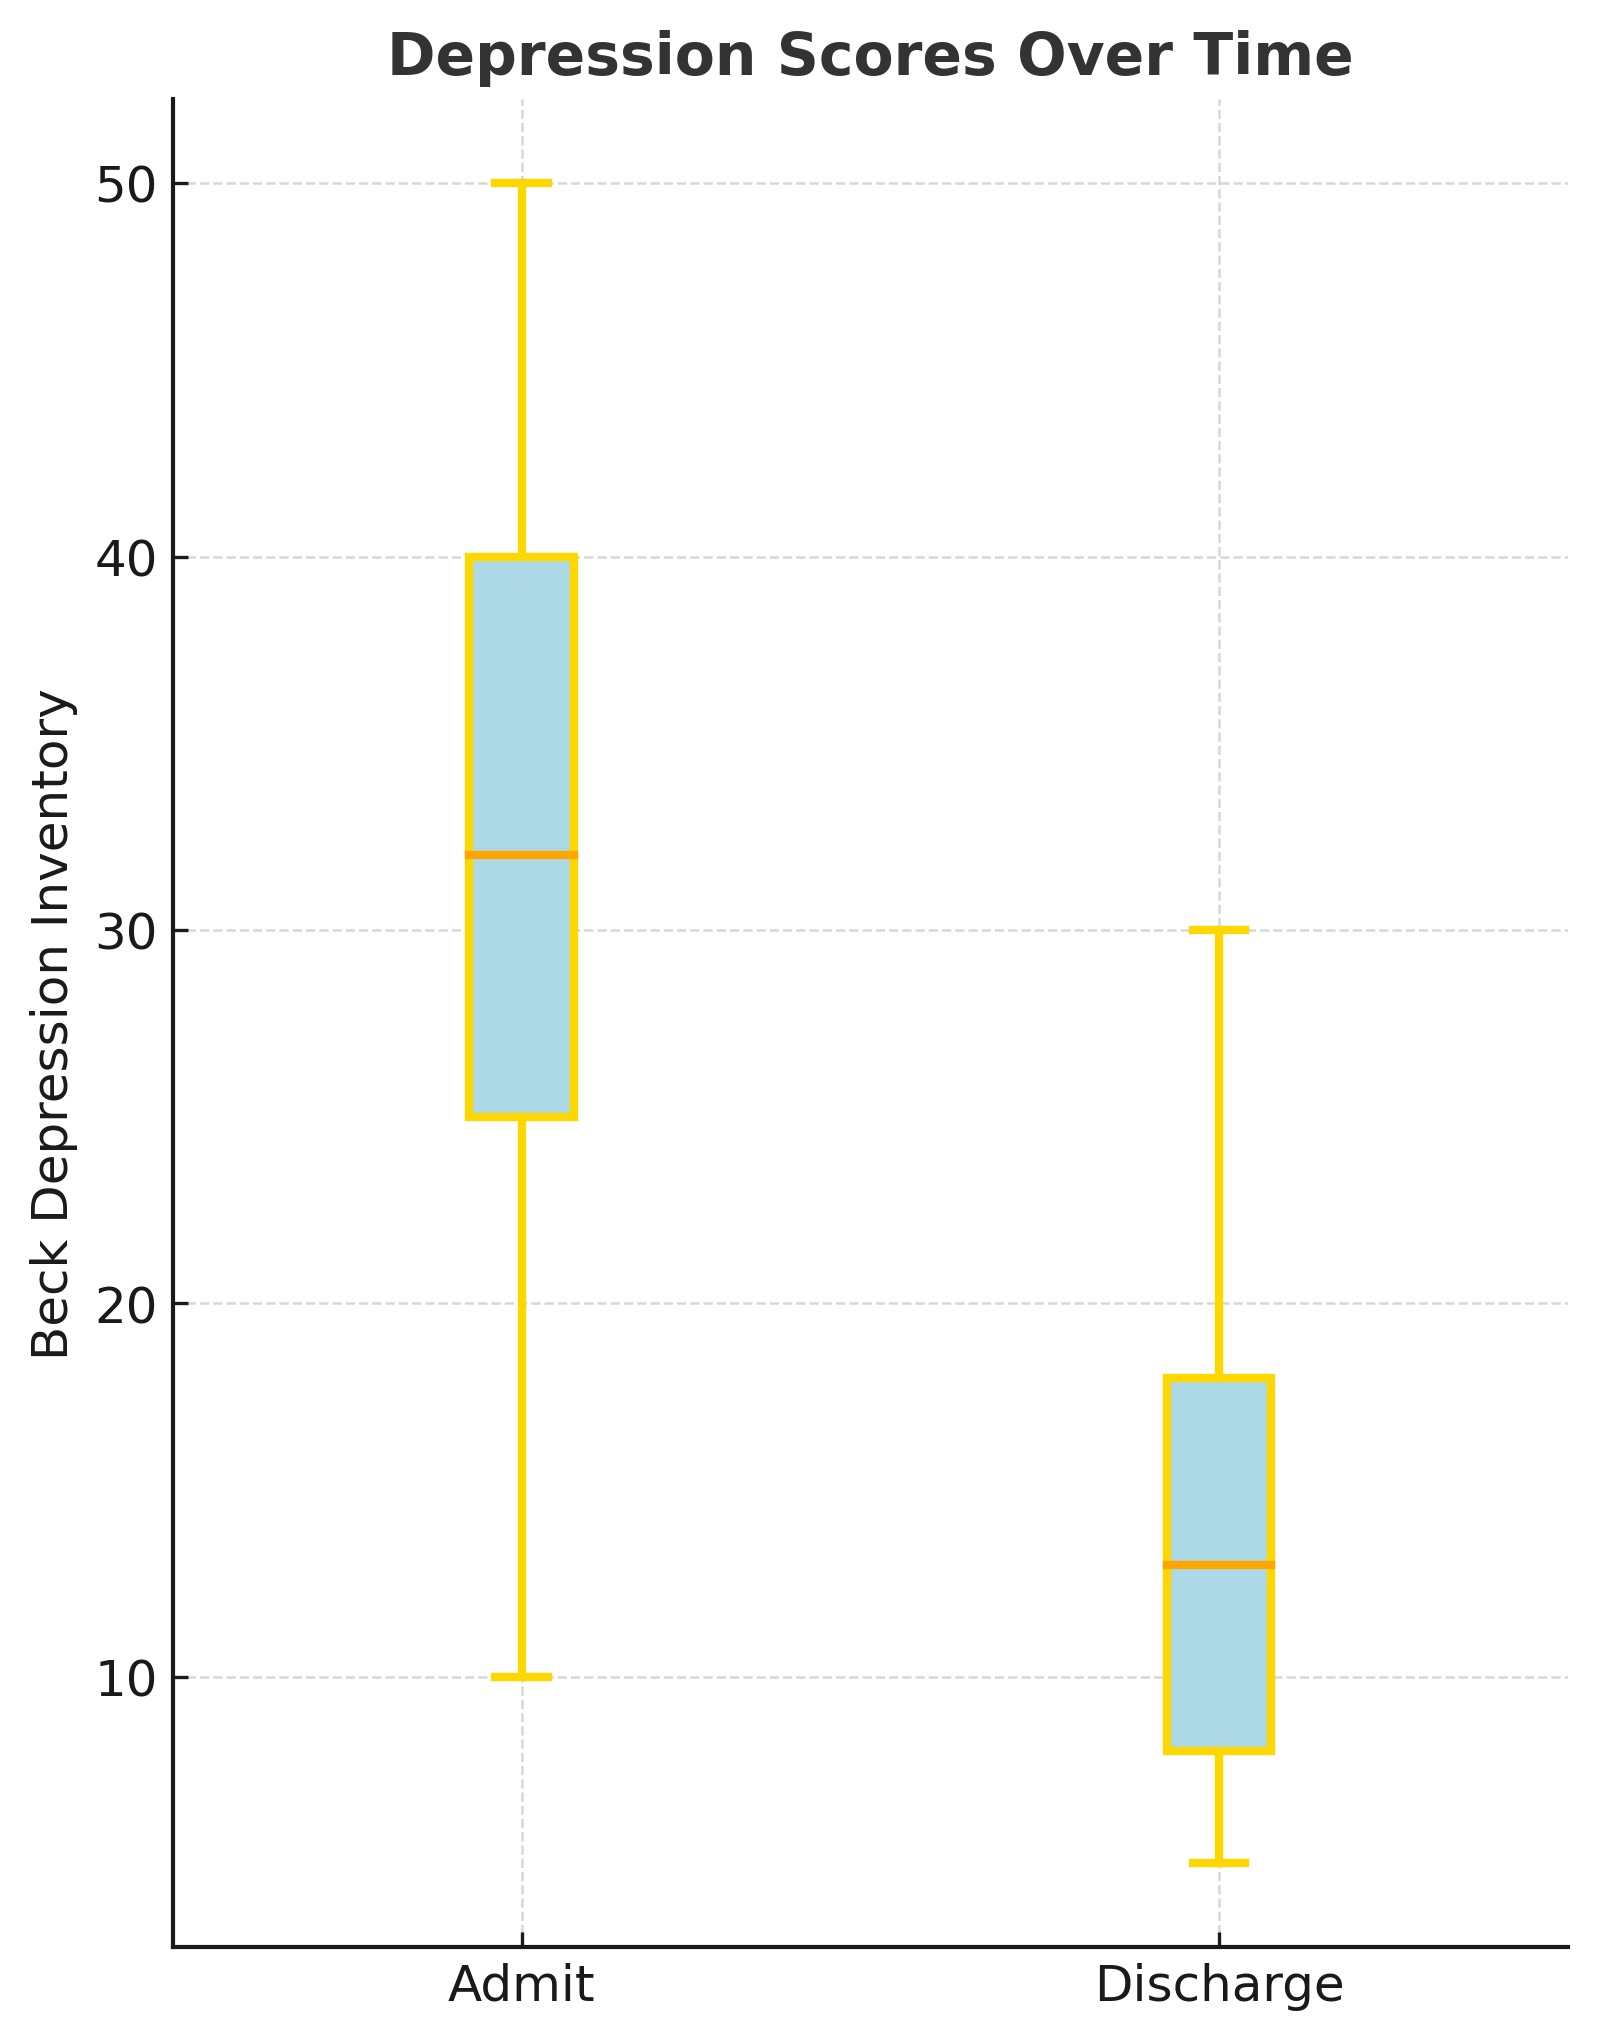
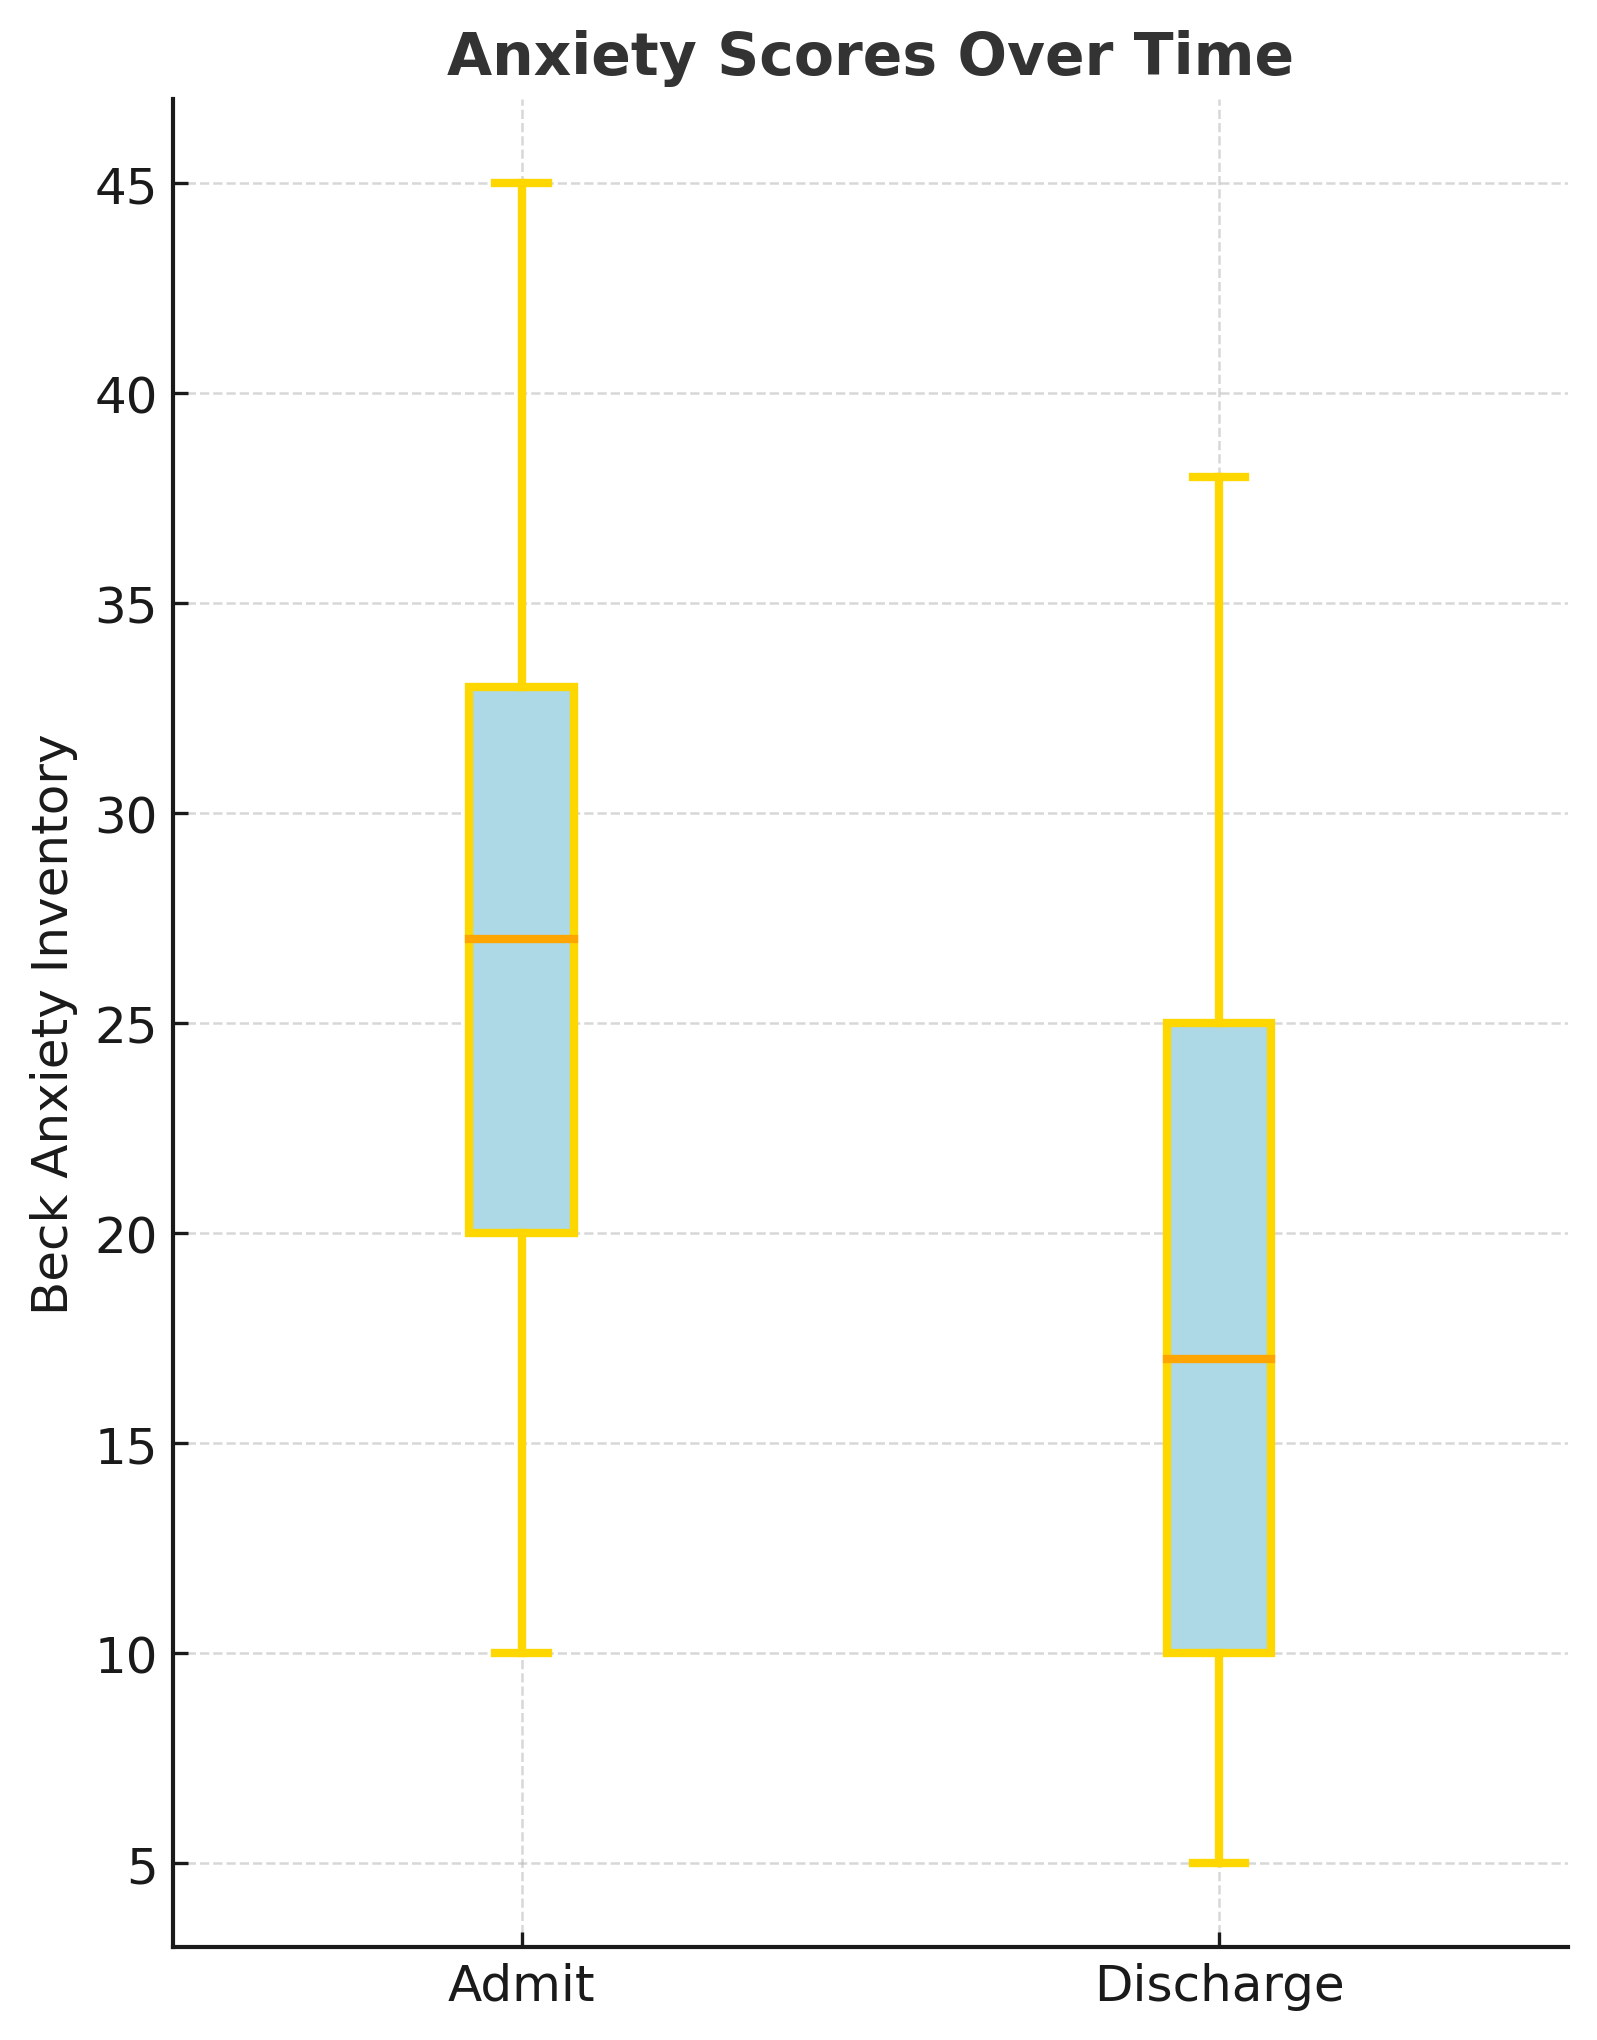
Solara Mental Health has the highest success rates of any comparable psychological treatment program, according to published statistics available.

Image link
Stack
Stack

What Makes Our Approach Different

From day one, we’ve prioritized rigorous clinical tracking. Every veteran at Solara receives detailed psychological assessments beginning at intake—repeated every 10 days throughout treatment and again at discharge. This frequent, structured evaluation allows our clinical team to immediately tailor care based on what’s working and what’s not.

This is not a checkbox protocol. It’s how we ensure each veteran receives the most effective, personalized care possible.

How We Measure Progress

We use industry-preferred, research-validated tools to track symptom change across time.

These assessments provide a consistent, objective view of how each veteran is improving—and how we can accelerate their recovery.

Beck Depression Inventory (BDI)
Measures severity of depression symptoms
Beck Anxiety Inventory (BAI)
Measures severity of anxiety symptoms

This allows us to:

Objectively track symptom change
Adjust treatment if progress stalls
Ensure therapies are working—across the board
Treatment Outcomes

Measured Results: 107-Veteran Sample

From a recent sample of 107 veterans, Solara observed strong clinical improvements in both depression and anxiety.

Summary

Depression

56% average reduction in symptoms
Median discharge score of 12—the threshold for full clinical remission

Anxiety

46% average reduction in symptoms
Cohen’s d > 0.9 = a statistically significant effect size across the sample

Depression and Anxiety Symptom Reduction Statistics

Image link

Measure

Mean (M)

Standard Deviation (SD)

BDI at Admit

32.5

10.0

BDI at Discharge

14.5

11.4

Change in BDI

18.0

11.9

BAI at Admit

26.6

8.3

BAI at Discharge

14.4

9.9

Change in BAI

12.2

10.6

Image link

Depression Scores Over Time

This chart shows a steep decline in depressive symptoms during treatment. The median score by discharge drops below 12—the clinical threshold for full remission.

Image link

Anxiety Scores Over Time

Anxiety symptoms also decline substantially across time. The drop is both statistically and clinically significant, with a large treatment effect (Cohen’s d > 0.9).

Each chart uses a boxplot to display score distribution at admission and discharge. The middle line shows the median score for the group.